The number of times I have personally gone on a cash hunt in my own business is way too often. I always do it before the cash-crunch hits us which is every August. Nowadays I also do it once a year at the end of the accounting year just for the fun of it, just to remind myself what kind of beast I am dealing with and because I am a bit of a masochist.
So why do product based business always run out of money?
There is one sentence I hear more than any other from product business owners: Our revenue is growing, our margins are good but we just do not have enough cash.
The thing is in product business the cash disappears to multiple little pockets. Most of it does not disappear, it just goes travelling. Most of the time around the world.
If you import stock from Asia and sell it on various channels and your own website, the question you actually need answered is a different one. Where exactly is the money right now, and how long until it comes back?
Follow one purchase order
Take for example a £100,000 production order from a Chinese supplier. Common terms are 30% on order and 70% before shipment or against the bill of lading. Which means you are fully invested in that stock before it is anywhere near you.
Here is where the money actually goes.
Day 0. £30,000 leaves the bank.
You place the purchase order and pay the deposit. Maybe you had enough money in the bank to finance that. Maybe you had to take some kind of credit.
Around day 35-50. Another £70,000 leaves.
Production finishes and the balance falls due. You have now paid the whole £100,000, and the goods may still be sitting on a factory floor in China.
This is the part generic cash flow advice skips. "Inventory purchases consume cash" sounds like a single accounting entry. Operationally it is the most painful part of the physical product businesses. You spend your money way way way before you are getting anything back. I compare it to investing in high-risk shares. You just put 100k on a ticket that may or may not give a return. Sometimes I have actually gone back and compared whether I would have actually invested that money on ETFs at the right time, would I be better off. The results are sometimes too shocking so I prefer to forget I ever even compared.
Day 35-50 to 80. Your money is on a boat.
China to Europe sea freight is not the 25 or 30 days that lot of spreadsheets still have built into them. A sensible 2026 planning assumption is 35 to 42 days port to port, plus collection, loading and whatever goes wrong. Latest geopolitical turmoils have made shipping even slower due to rising energy costs.
During those weeks 100% of the manufacturing cost has left your bank, the goods cannot be sold, the money cannot be used for anything else, and you are probably already looking at the next production order.
Arrival does not mean sellable
Eventually the box reaches you. Then there is customs clearance, port release, haulage, delivery, stock-in, possibly final QA.
It can take a week or two for the stock to actually become sellable.
On an optimistic timeline the first unit becomes sellable around day 100 after that first deposit left your account. The realistic timeline is about 120 days, sometimes even worse. If your product is handmade you need to add a serious lag to these days.
And a sale is not money either
This is the second place where your revenue based spreadsheets lie to you.
You have finally sold something but the bank balance is not moving.
If you sell on platforms, eg Amazon, they like to hold your money for a couple of weeks. If you sell to business customers, in the worst case scenario they take your stock and only pay you once their customers have bought it. You are looking at possibly another 60 days waiting for the payments although it can be a bitter lump sum at once.
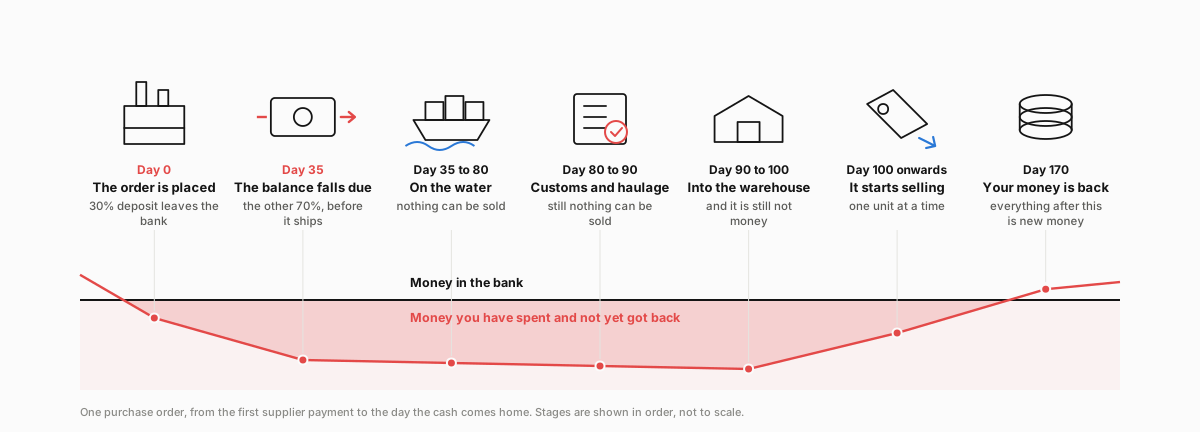
So the whole thing looks like this.
- Day 0, deposit paid
- Day 35, balance paid, 100% of product cost now out
- Day 35 to 80, in transit
- Day 80 to 90, customs, release, inland delivery
- Day 90 to 100, receiving
- Day 100 onwards, it starts selling
- Sales plus a couple of weeks or months, the money starts arriving.
And of course the order does not all sell on day 100. Sell-through might take another three or four months, or even six.
So from the first supplier payment to the last customer payment landing in your account, a completely normal SKU is a seven to ten month round trip.
That is where the money went.
So how many do I have to sell before I have my money back?
This is the question almost nobody asks, and it is the one that puts a date on the whole thing.
Not how many units break even against the P&L but how many units before the £100,000 that left my account has come back into my account.
Take the same order. Say the unit sells for £20, and the numbers are the ones I see most often.
- COGS 30%, so £6 a unit landed
- Selling and platform fees 15%, so £3
- Marketing 20%, so £4
£100,000 of stock at £6 a unit is 16,667 units.
Now the important bit. The £6 is already gone. You paid it months ago. So every unit you sell from that container puts £20 minus £3 fees minus £4 marketing into the bank.
£13 a unit.
£100,000 divided by £13 is 7,692 units.
Which is 46% of the order.
So you are selling almost half a container before you own your own money again. The other 54% is the part that is actually yours.
There is a one line version of this and it is worth writing on the wall.
COGS % divided by (1 minus fees % minus marketing %) = the share of the order you must sell to get back to zero.
30 divided by 65 is 46%. That is it.
Which means it moves fast when the cost structure moves.
| COGS | Fees | Marketing | Share of the order you must sell to break even in cash |
|---|---|---|---|
| 25% | 15% | 20% | 38% |
| 30% | 15% | 20% | 46% |
| 30% | 15% | 30% | 55% |
| 35% | 15% | 25% | 58% |
| 40% | 15% | 25% | 67% |
| 40% | 15% | 30% | 73% |
Look at the bottom row. Add 10 points of COGS and 10 points of marketing and you have gone from selling 38% of the container to selling 73% of it before you are whole. Same product, same factory, same 16,667 units. The difference is which day your money comes home, and whether the last quarter of that container is profit or just the tail of an investment you have already made.
Two things this does not include, so be honest about them. Your fixed costs, which carry on regardless and have to come out of that as well. And returns, which take units back off the sold pile and leave the fees behind. Put freight and duty inside COGS, not next to it, or the number lies to you.
Which day is that?
Now put it back on the calendar. The container starts selling on day 100. Say it sells through in four months, so 120 days at about 139 units a day.
7,692 units at 139 a day is 55 days of selling. Day 100 plus 55 is day 155. Add for example the Amazon settlement lag of 14 days and the money is actually in the bank around day 170.
Five and a half months after the deposit left.
Everything that arrives before day 170 is your own money walking back through the door. Everything after it is new money. By the time the last unit settles, around day 234, the container has returned £13 times 16,667, so about £216,000 against the £100,000 that went out.
That is a good order. It is also nearly eight months of your cash being somebody else's problem to hold.
And here is the part that ruins people. When do you have to place the next order?
Around day 120, if you do not want a stockout.
Which is 50 days before the first one has paid you back. So order two is funded out of order one's money before order one has finished returning it. Do that with a growing order size and you can be profitable on every single unit and still run out of cash in month nine.
If you know only one date in your business, know this one. Not the margin. The day the money comes back.
This is why growth makes cash worse
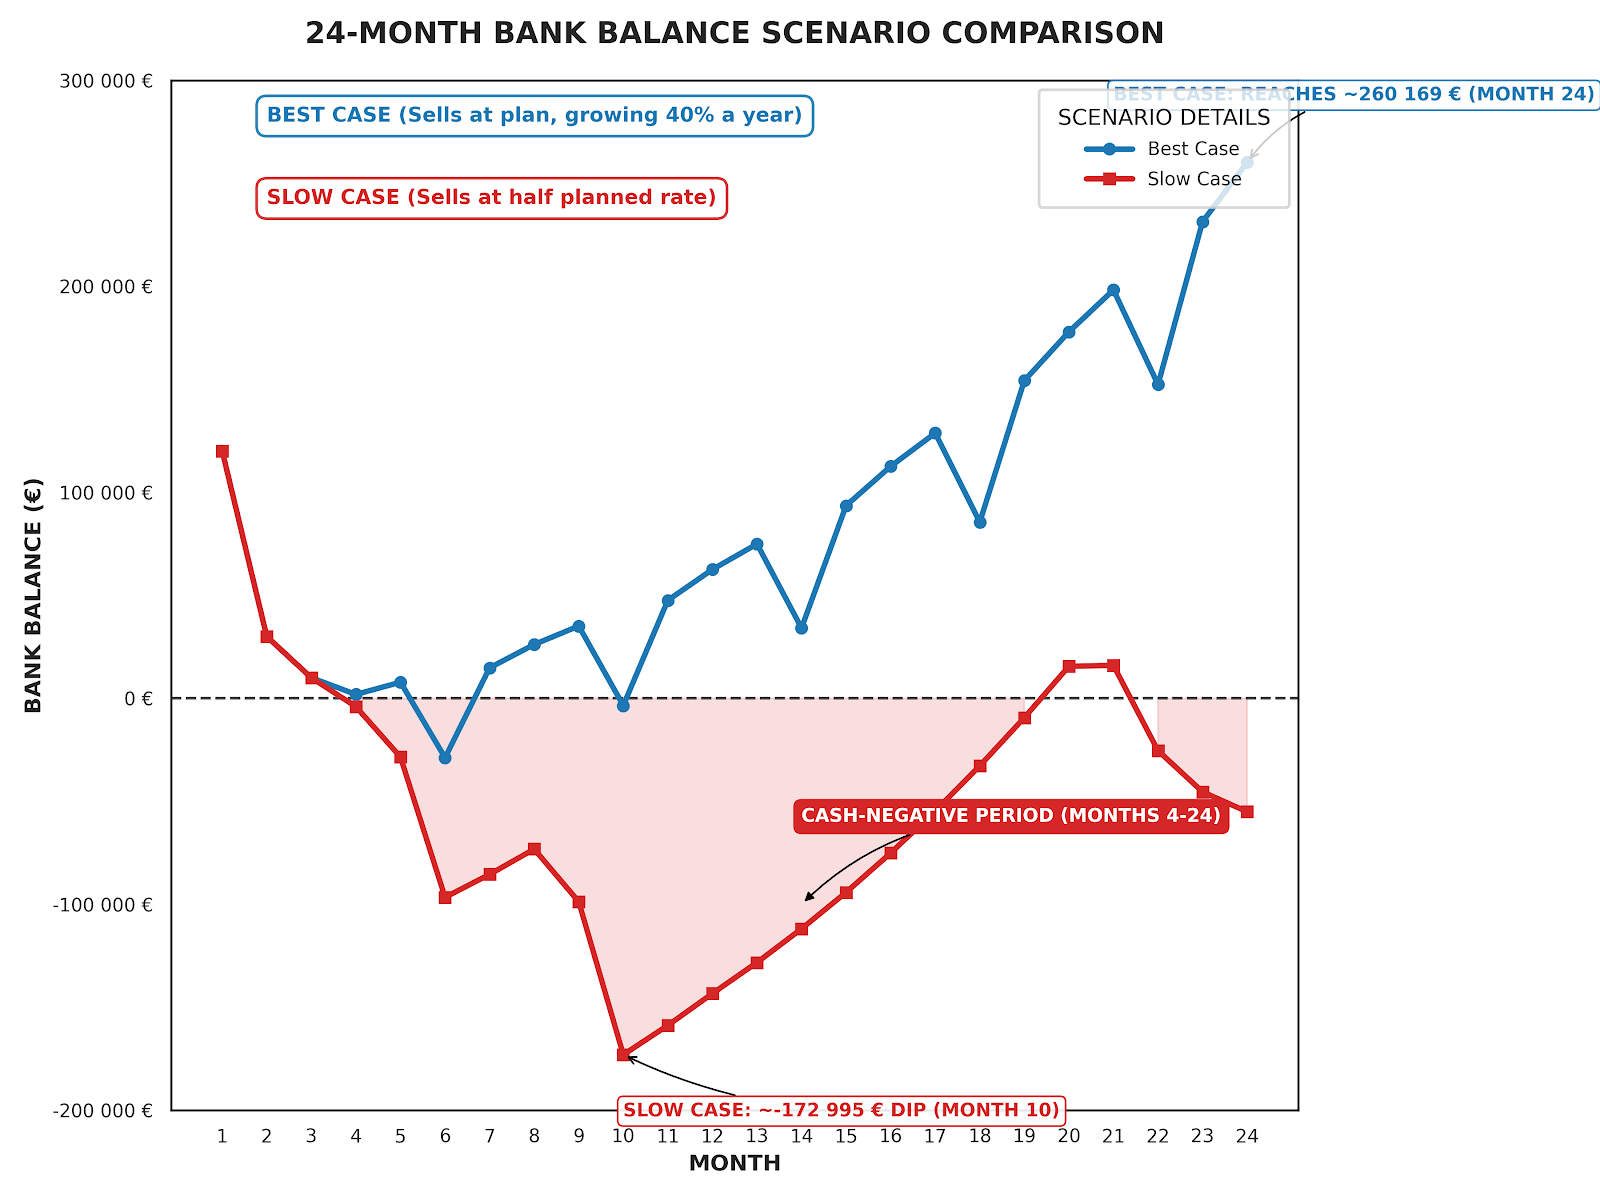
Now put 40% growth on top which is something we all want. This is how we plan our businesses, just put bigger revenue targets on excel files and bobs your uncle.
If you reach it, great! Except next year's purchase orders have to be bigger, and they have to be placed before the cash from the current ones has come back.
That is the paradox in most growing product businesses. Growth produces profit eventually and consumes cash immediately.
The faster you grow, the more orders are inside this cycle at the same time. So you can have rising revenue, a healthy gross margin, positive EBITDA, more stock than you have ever had, and a bank balance that gets worse every month.
Nothing is necessarily wrong with accounting. The money is on the balance sheet. Mostly as stock.
Stock is the whole game in consumer businesses.
And what if it does not sell
Everything above assumes the plan happens. 139 units a day, four months, done.
Now the version nobody models - what happens to cash if it sells at half the rate?
So lets play this with 69 units a day instead of 139. The payback point does not move by a few weeks, it moves from day 170 to around day 225, and the last unit does not settle until roughly day 355. Your £100,000 is now out of the business for the best part of a year instead of eight months.
That alone is survivable. What kills people is what they do next.
Because when something is not selling, nobody sits still. There are three moves and all three of them cost you.
1. Spend more on marketing.
Marketing goes from 20% to 30% to force volume. Put that back in the formula. 30 divided by 55 is 55%, so the break-even share of the container has gone from 46% to 55%. In units, from 7,692 to 9,091.
You now have to sell 1,400 more units to get back the same £100,000.
Advertising your way out of a stock problem moves the finish line further away while you are running at it.
2. Cut the price.
Drop £20 to £18. Fees are 15% so £2.70, marketing 20% so £3.60, and you keep £11.70 a unit instead of £13. Break-even goes to 8,547 units, 51% of the container. Go to £17 and it is 9,050 units, 54%.
And the discount does not end when the excess is gone. You have taught the algorithm and the customer a price you cannot afford at your normal cost. Going back up is a second project, and it costs rank.
3. Do nothing and hope.
This one feels free. It is the most expensive.
Storing stock costs money every day. For example Amazon charges you £0.76 per cubic foot between January and September to £1.51 between October and December.
Say each unit is 0.1 cubic foot which is like 30cm x 30 cm x 30 cm. A full container is 1,667 cubic feet, so £1,267 a month in the quiet part of the year and £2,517 a month in Q4. If half of it is still sitting there in November, you are paying roughly £1,250 a month for the privilege of owning something nobody wanted in March. Then aged inventory surcharges start on top, charged every month, and they do not stop until the stock moves.
What the excess is actually costing you
Storage is the visible cost but the real cost is the order you cannot place.
We all work business with multiple skus. We need to reorder stock at the day 120. The SKU that is working needs its next container, and the money for it is sitting in a box of the SKU that is not working. So you do one of three things. You skip the reorder and go out of stock on your best product, which costs rank and takes months to rebuild. You borrow. Or you place a smaller order than the demand justifies, which quietly caps the business at the size the dead stock allows.
That is the degradation. It is not the storage fee. It is that a bad product stops a good one from growing, and it does it silently, because nothing in the P&L has a line called "the order we did not place".
I am also not counting the time. The re-pricing, the new images, the fourth attempt at the ad campaign, the meetings about it. There is alternative cost here and it is high.
Excess stock does not hold its value while you decide
This is the part that surprises owners. The stock is on the balance sheet at £6 a unit, so it feels like £100,000 of asset sitting there, waiting patiently.
It is not waiting. It is melting.
Illustrative, but the shape is right for most consumer goods.
| When you act | What you can realistically do | Cash back per unit |
|---|---|---|
| Month 4, first sign it is slow | Modest discount, it still sells | £11 to £13 |
| Month 8 | Deep discount, heavier ads | £8 to £9 |
| Month 12 | Clearance, outlet, bundle | £3 to £4 |
| Month 18 | Liquidator, removal or disposal | Near zero, sometimes negative after fees |
Cost is a number from the past. What the stock is worth is what somebody will pay for it this week, and that number falls every month while the storage cost per unit stays the same and the aged surcharges get bigger.
So the value of deciding early is enormous, and nobody prices it. Deciding at month 4 that this product is a mistake gets you £11 a unit and your reorder money back. Deciding at month 18 gets you a removal fee and a lesson.
You can see it by day 130
Here is the useful part. You do not need to guess.
You know the plan was 139 units a day. Thirty days after it went live you know the actual rate. If it is 70, the model already tells you the payback day has moved from 170 to 225, and it tells you the reorder at day 120 is now unfunded.
That is not a year-end discovery. That is a day 130 decision, made with one number you already have.
The cheapest day to deal with dead stock is the first day you can see that it is dead. The most expensive is the day your accountant tells you, eleven months later, in a meeting about something else.
The question is not only "is this SKU profitable"
This is where management reporting for product businesses usually goes wrong. We spend the time on gross margin, contribution margin, is the SKU profitable.
All fair questions. But I would add two more.
How much cash does this product need before it gives £1 back? And for how many days is that cash unavailable to me?
A product with a beautiful margin on paper can still be a terrible use of capital if you have to buy six months of stock, pay the supplier before it ships and then wait two months for it to arrive. A slightly worse margin that turns quickly and can be reordered in small batches often builds the healthier business.
Margin tells you what you earn. Cash velocity tells you how much business you can afford to do at all.
There are levers, but they are not in the P&L
Once you look at the business as a cash cycle rather than a P&L, the questions change.
Can we move 30/70 to better terms now that we have a track record with this supplier? Can we get the minimum order quantity down? Can we order more often in smaller batches? Which SKUs have capital sitting in them for 180 days? Which products are growing and eating a disproportionate amount of working capital? Are we placing this order because the forecast says so, or because we are frightened of running out?
And the one that matters the most. What happens to cash if sales grow 20%, 40%, 60%?
Because a growth plan that does not include the cash to fund it is not a growth plan.
It is a sales forecast.
Every one of those questions resolves at the same moment, and it is earlier than most teams look. Profit is made at the moment of buying, not at the moment of selling.
Build the model around the physical business
For a product company the model should not start with an annual P&L. It should start with what physically happens.
Purchase order, deposit, production, balance payment, freight, customs, warehouse, sell-through, marketplace reserve, settlement, bank.
Put dates and pounds on every one of those stages. Do it per major SKU or product family. Then put the growth on top.
Suddenly the cash problem stops being mysterious. You can see which purchase order creates the lowest point in the bank balance. You can see whether the next order is fundable. You can see which products are holding your capital hostage.
And you can tell the difference between a business that is not profitable and a business that is profitable but structurally hungry for working capital.
Those are two very different problems. The first one needs better economics. The second one needs better management of the cycle.
Get them the wrong way round and you can grow yourself straight out of money, with a good margin the whole way down.
Rebuilding that model by hand every month is the kind of work worth handing to a machine, but only once the numbers underneath it are right. That is what AI is actually for in a product business, and it is not writing your product descriptions.